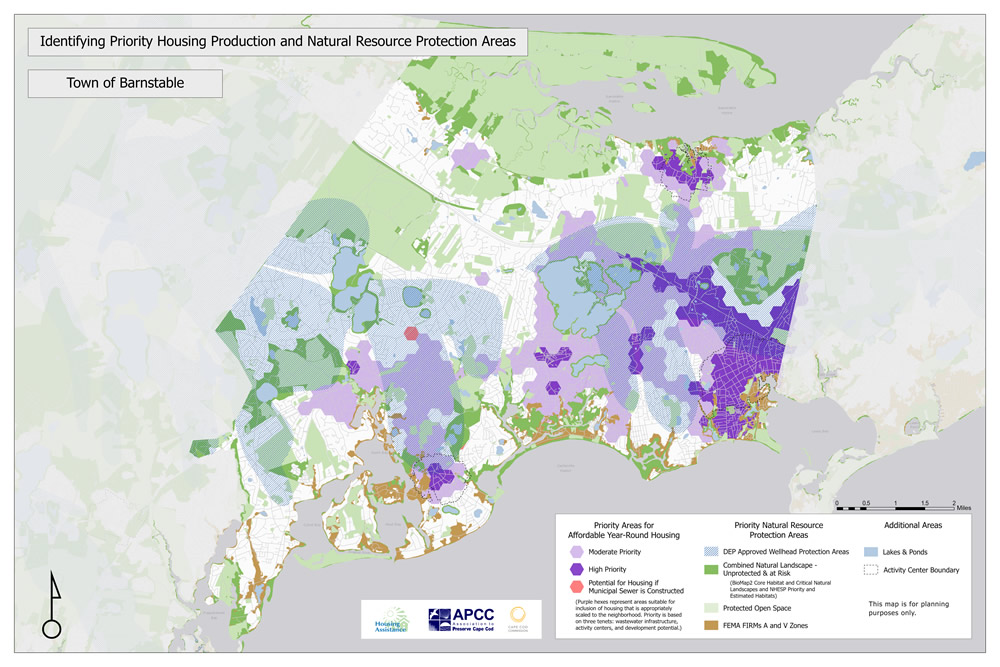
Barnstable

Barnstable Zone II focus
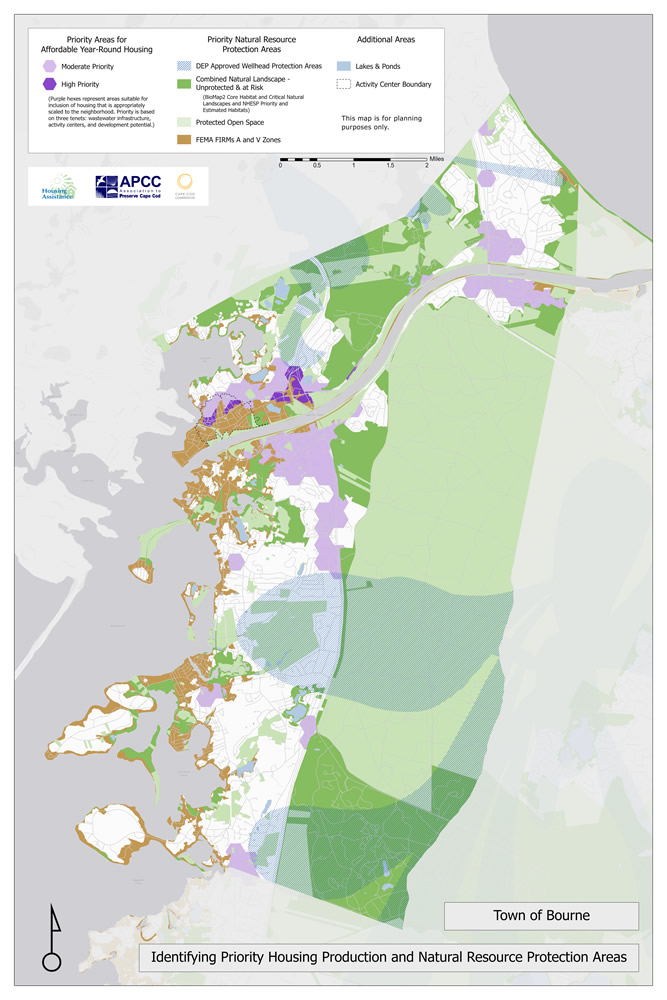
Bourne
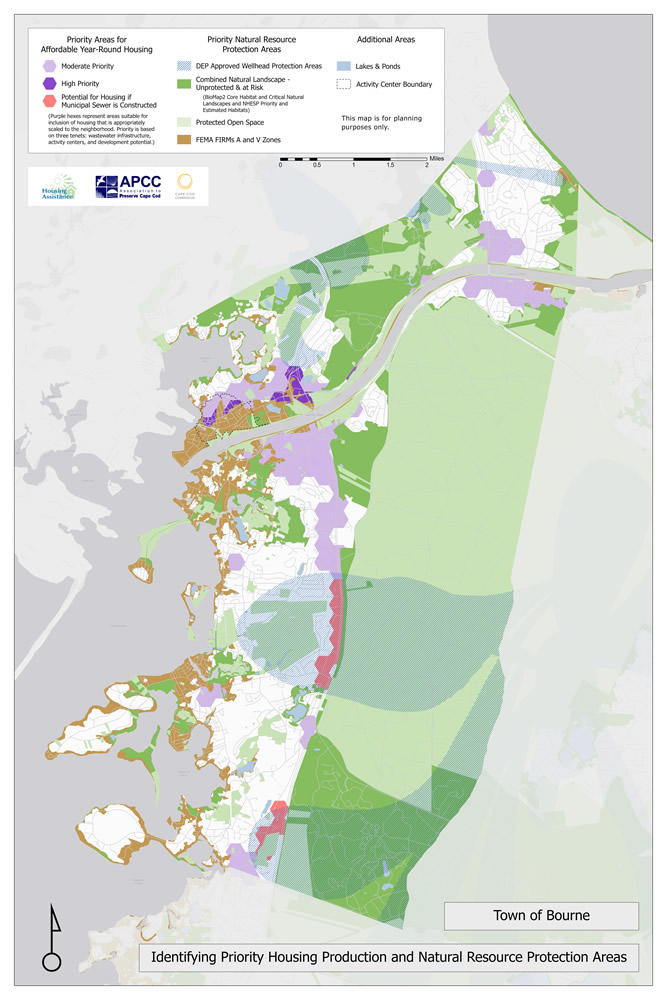
Bourne Zone II focus
Brewster
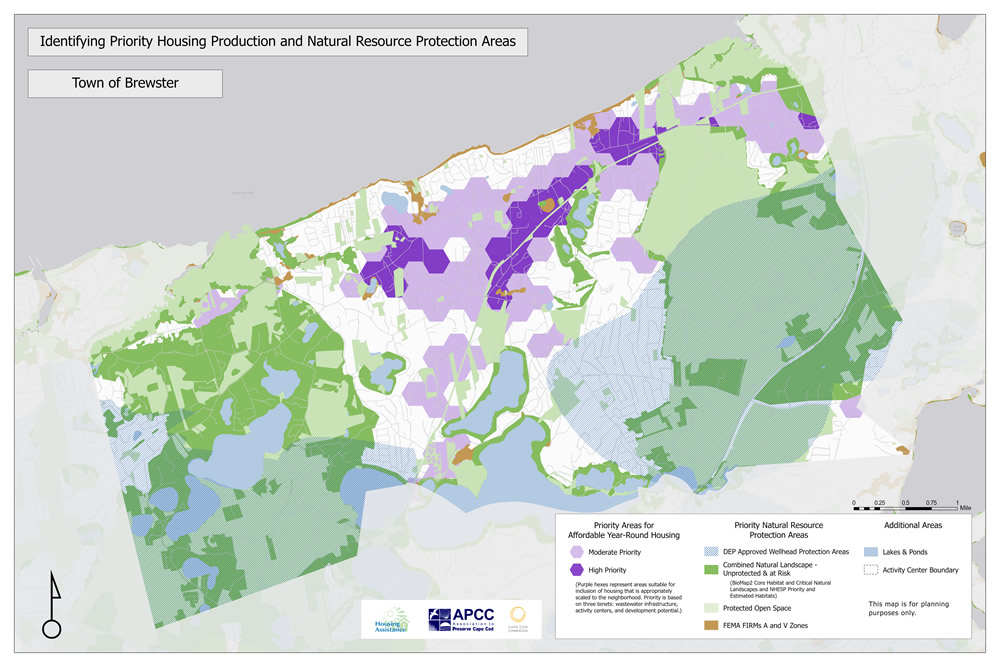
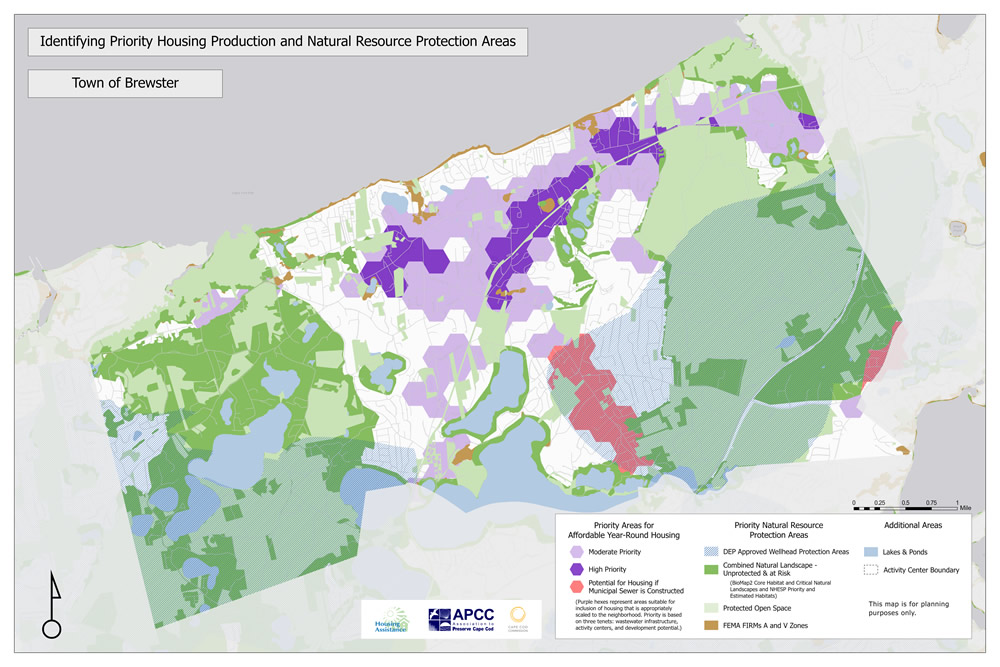
Brewster Zone II focus
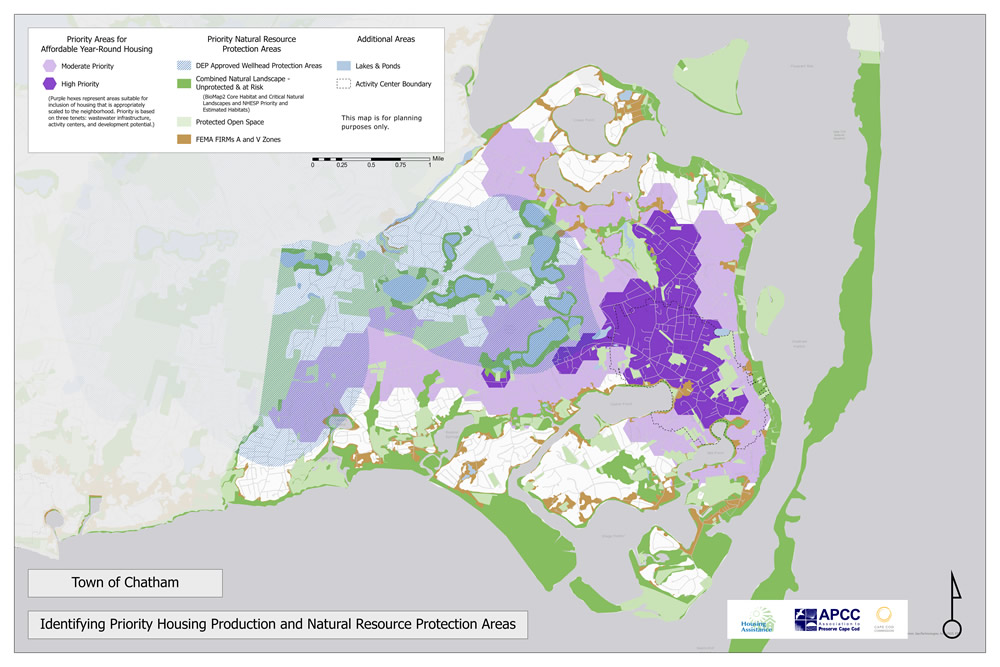
Chatham
Falmouth
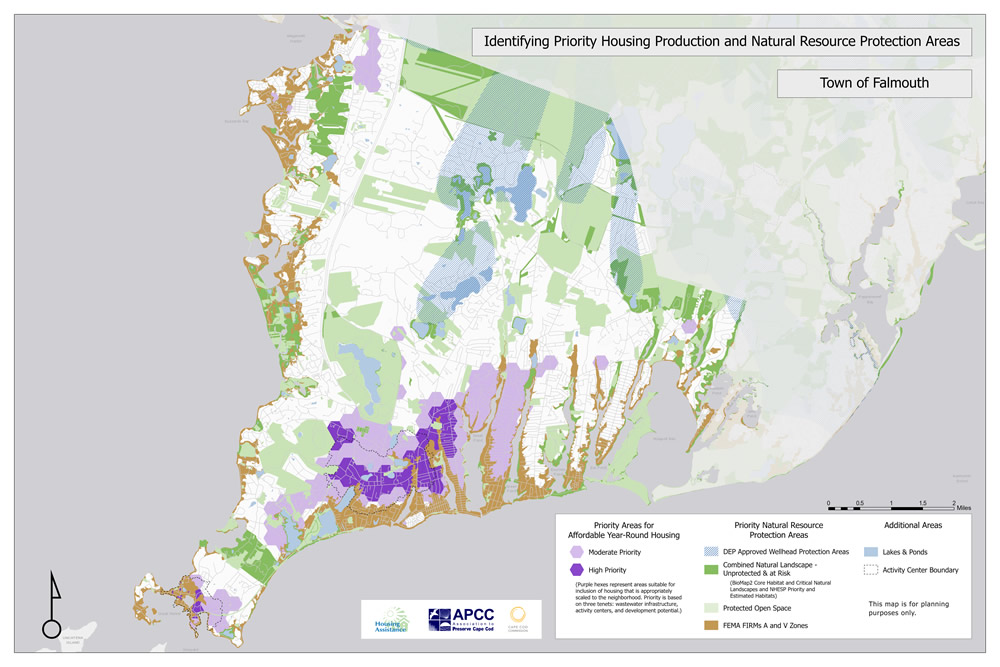

Falmouth Zone II focus
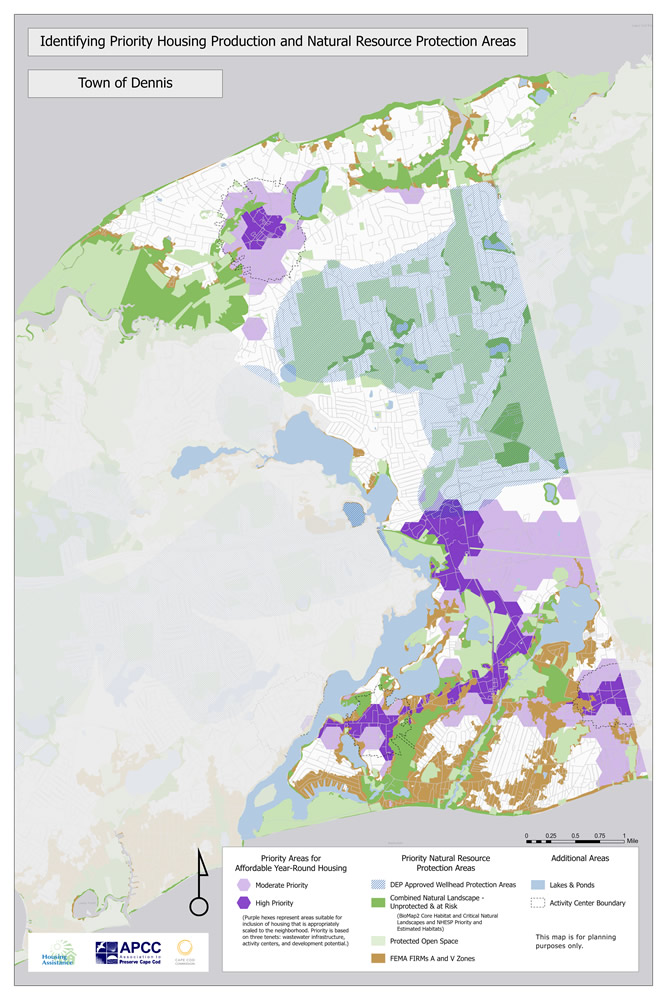
Dennis
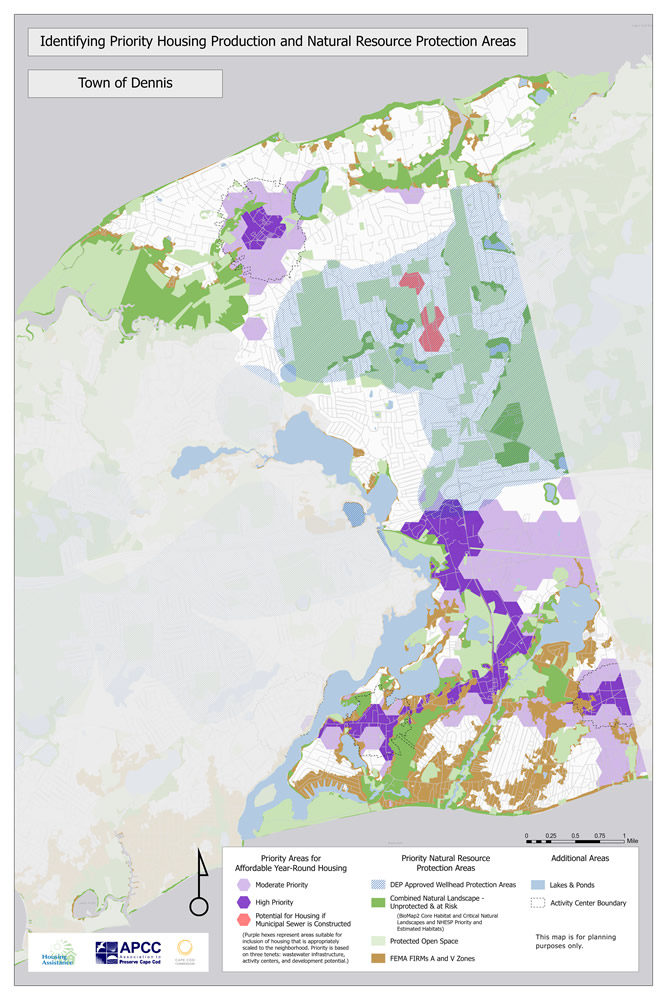
Dennis Zone II focus
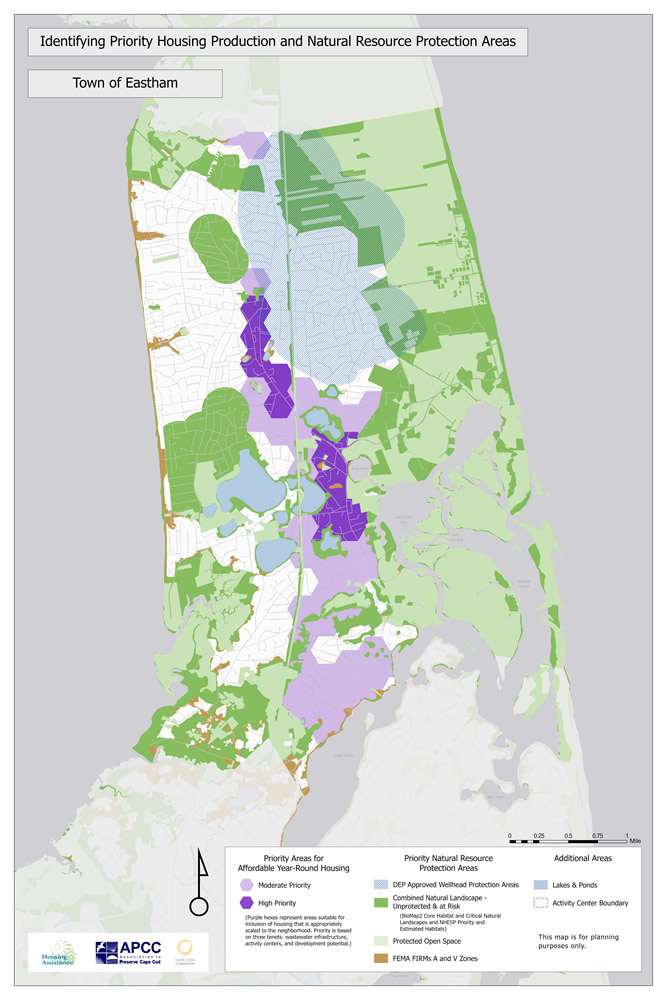
Eastham
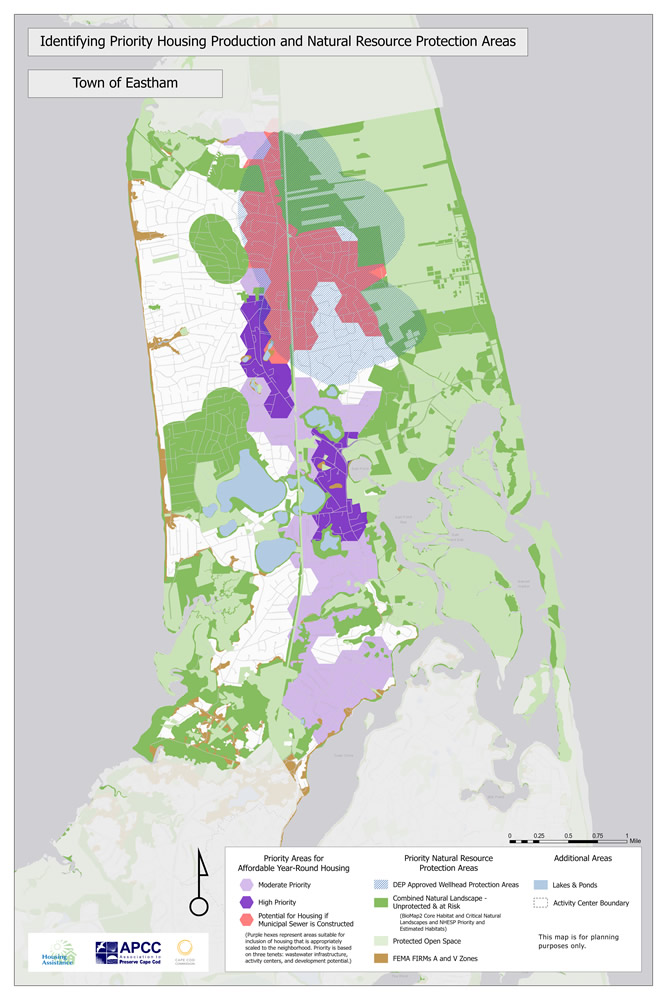
Eastham Zone II focus
Harwich
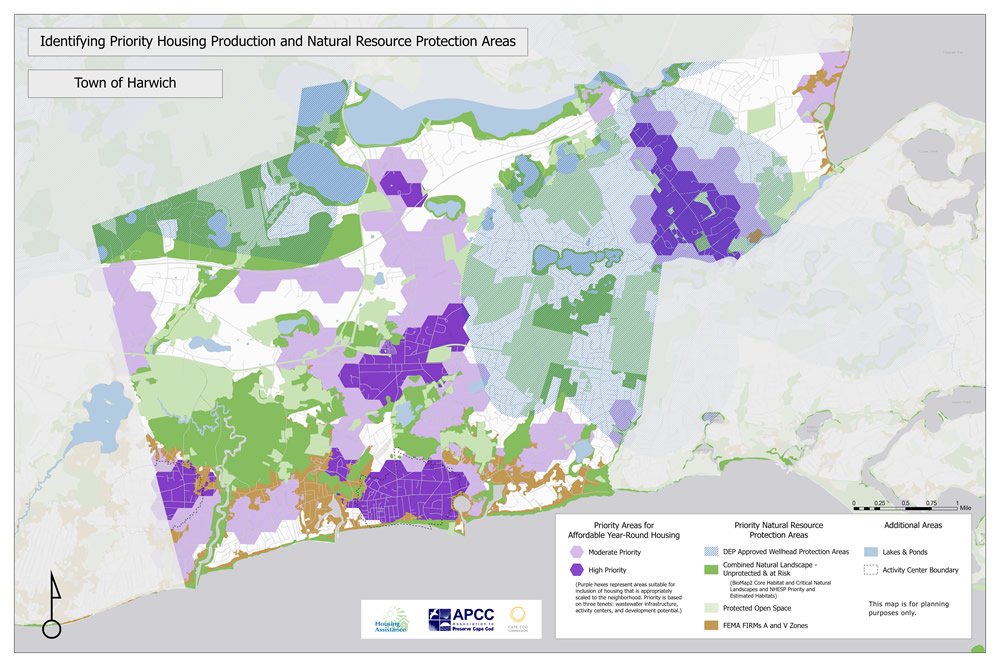
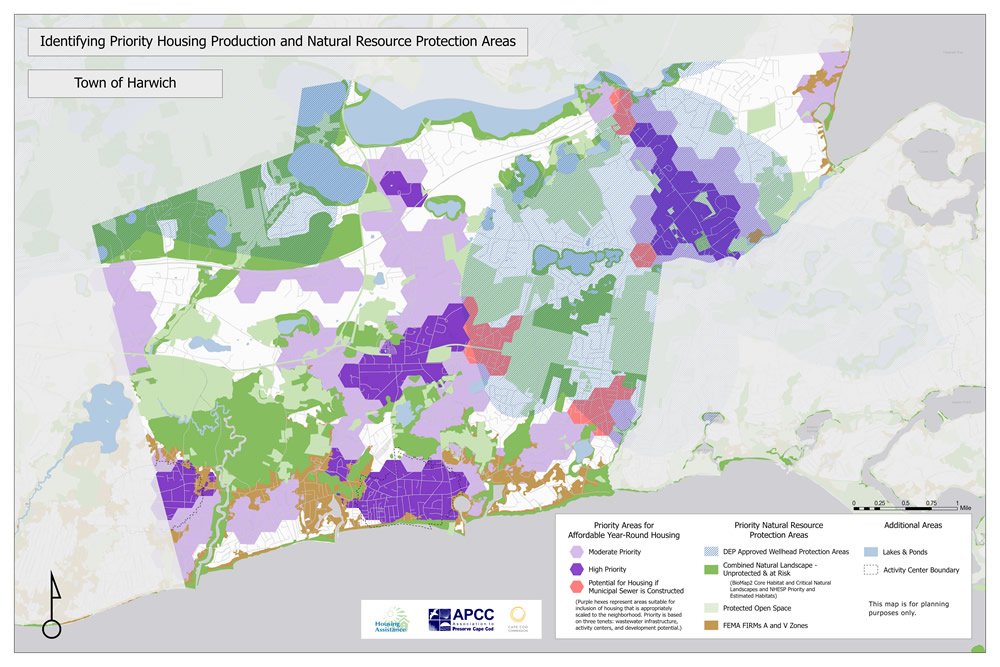
Harwich Zone II focus
Mashpee
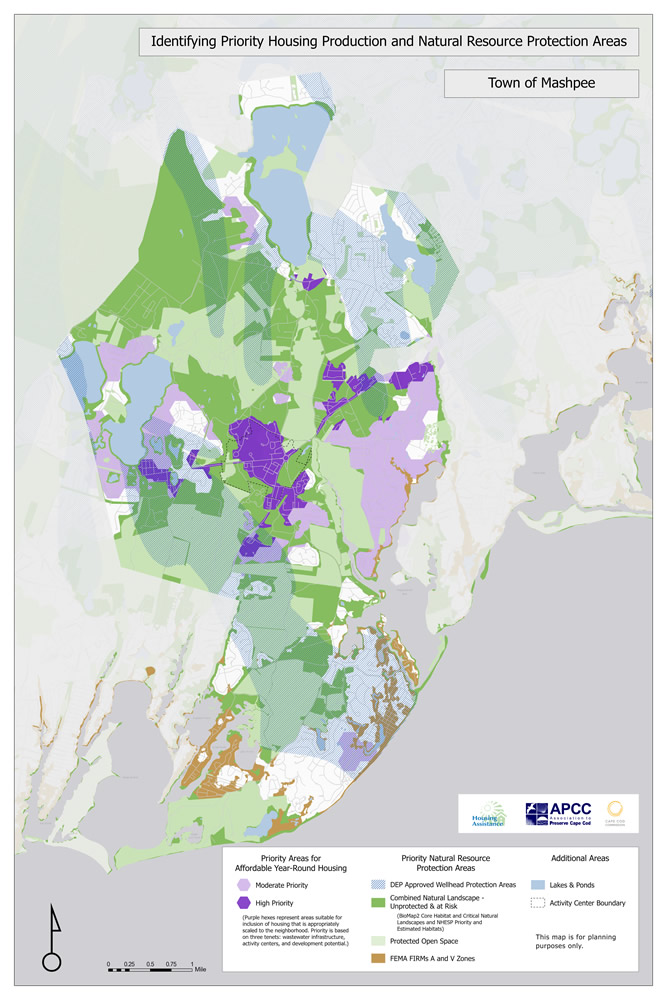
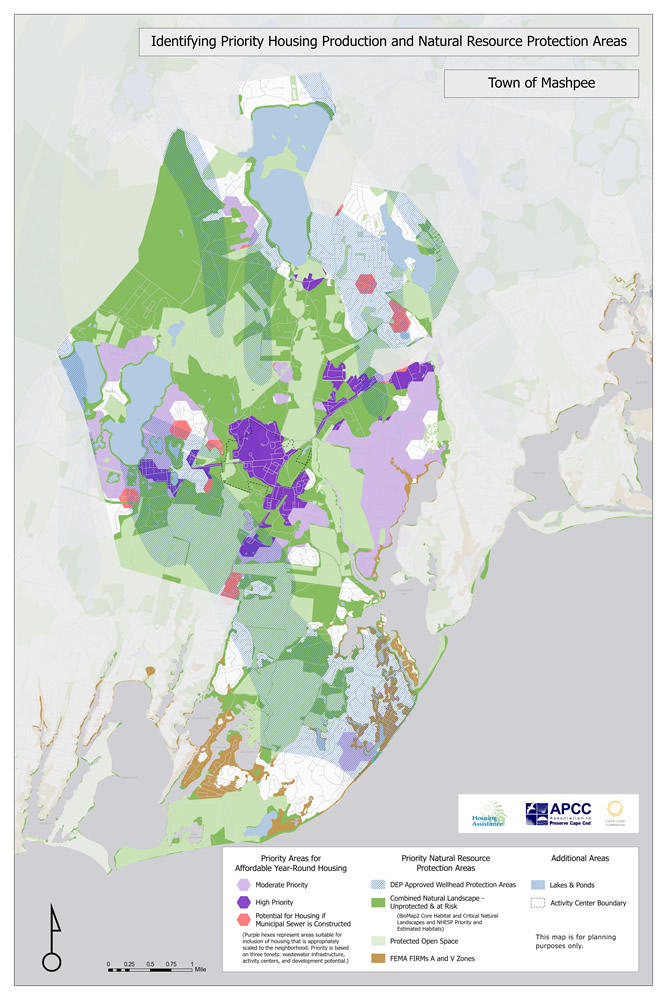
Mashpee Zone II focus
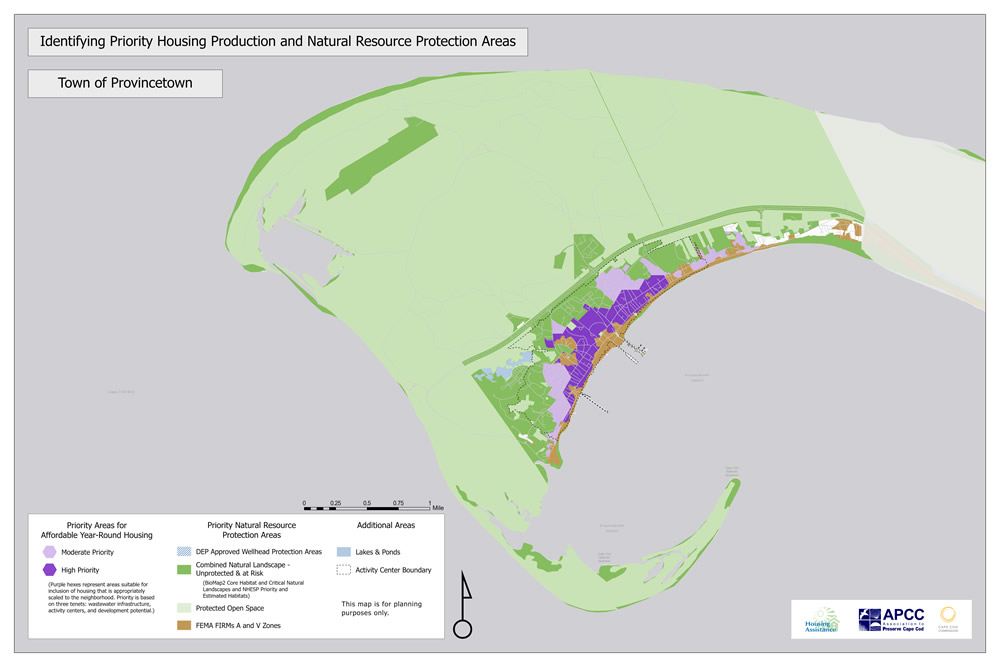
Provincetown
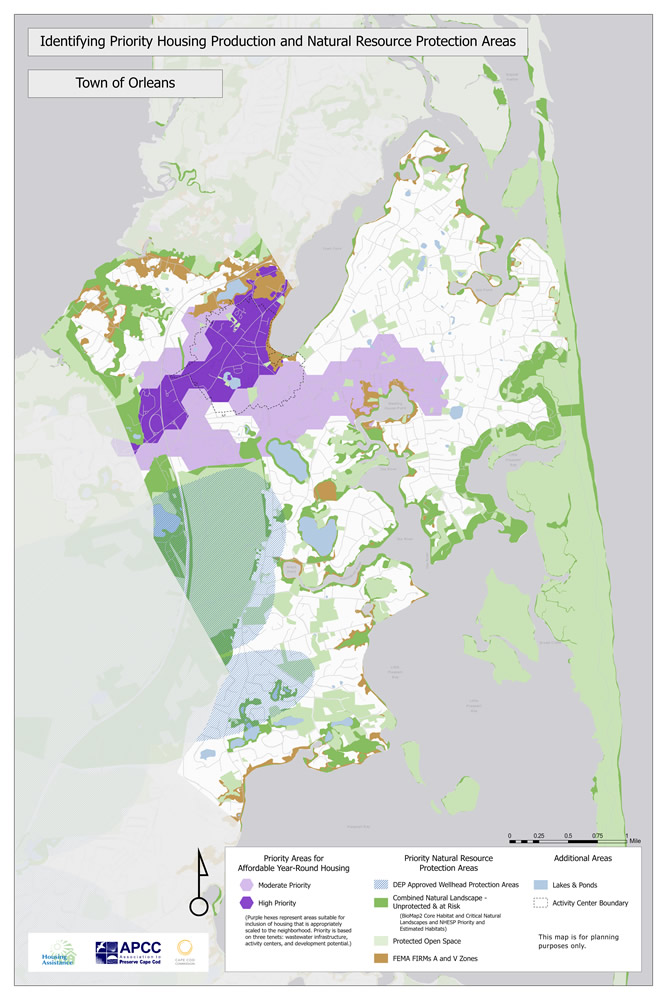
Orleans
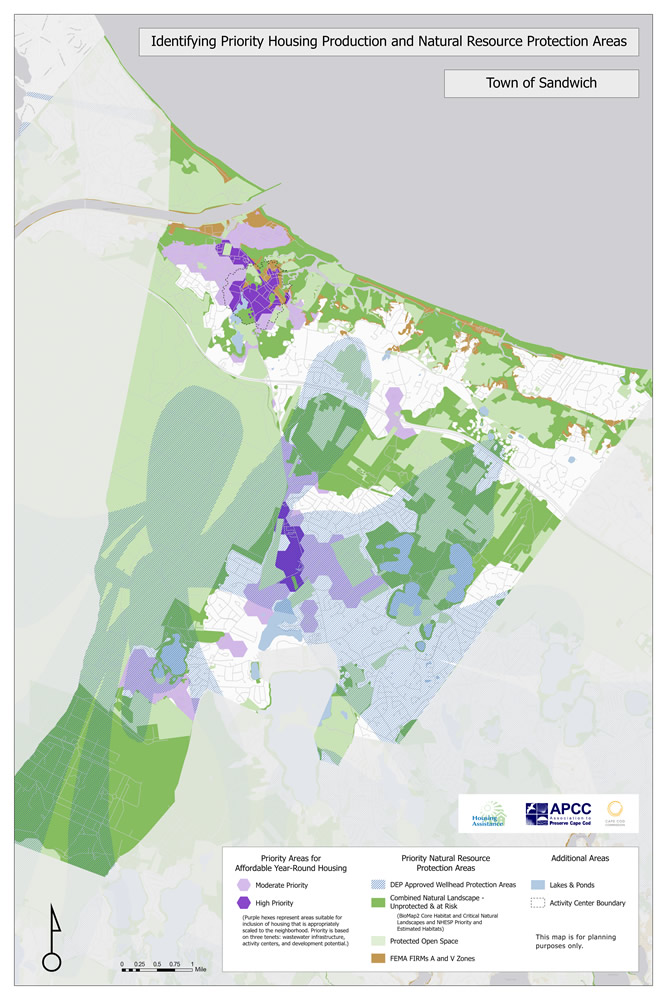
Sandwich
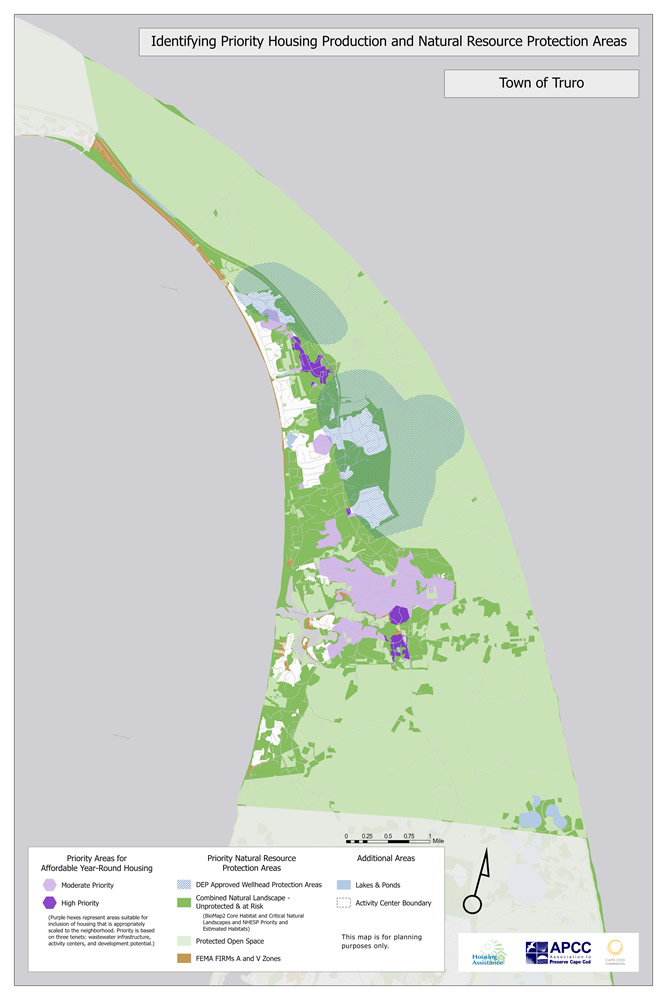
Truro
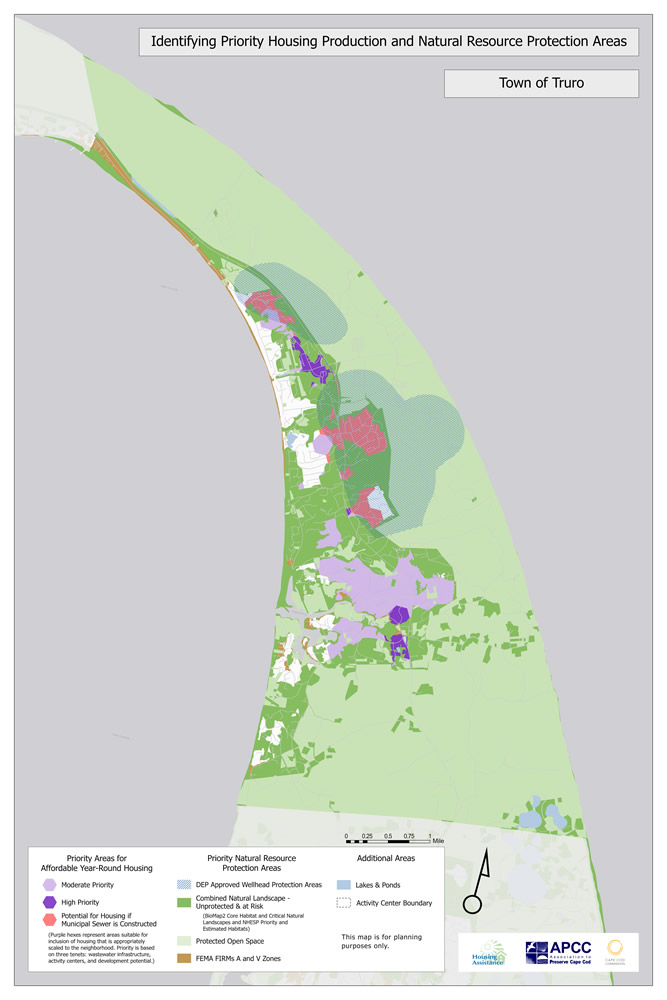
Truro Zone II focus
Wellfleet
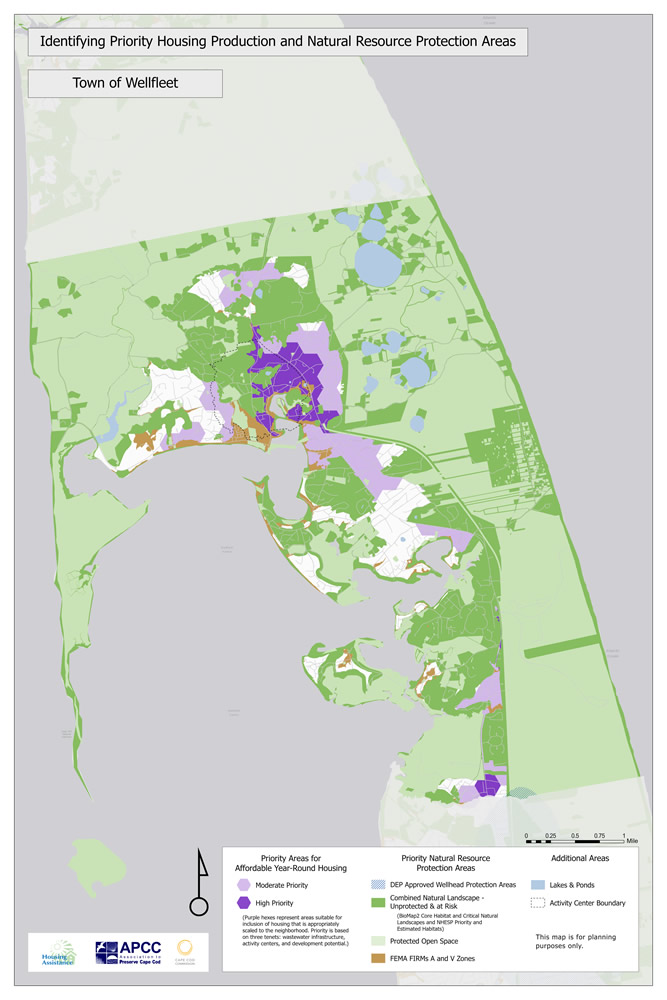
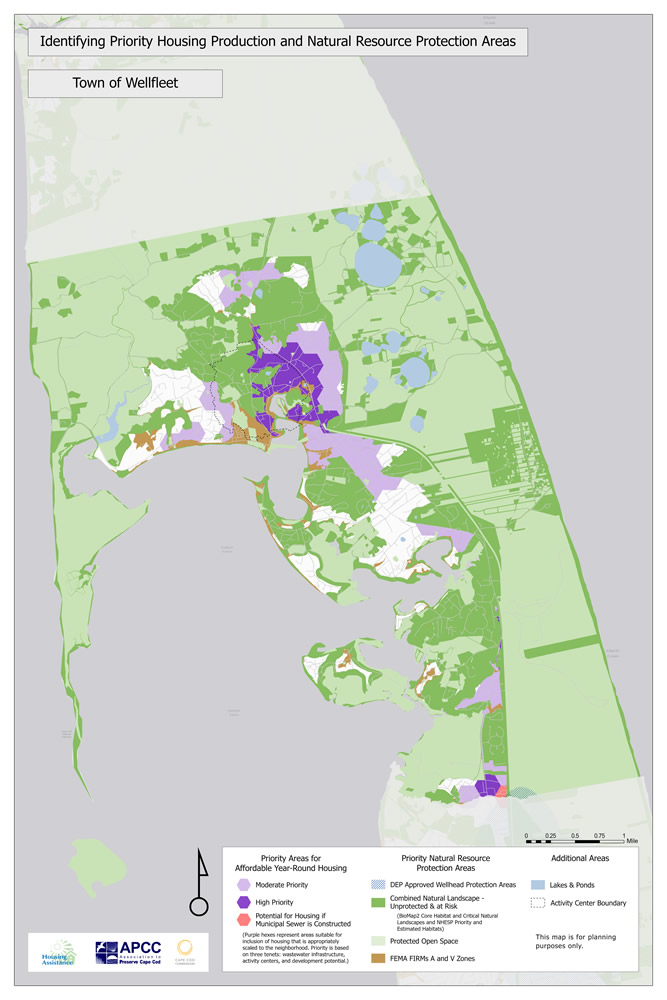
Wellfleet Zone II focus
Yarmouth
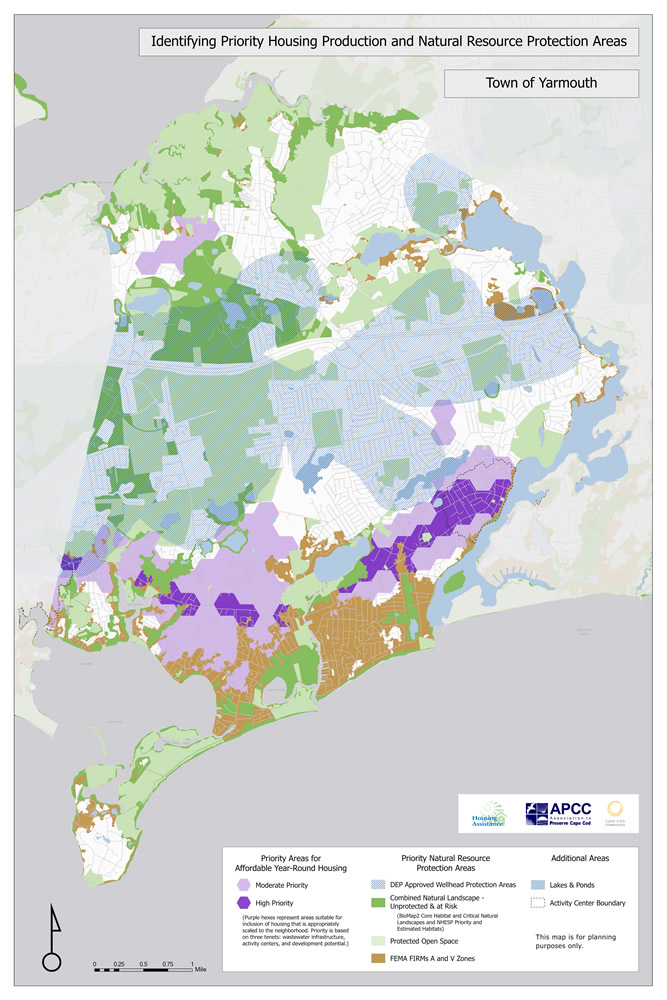
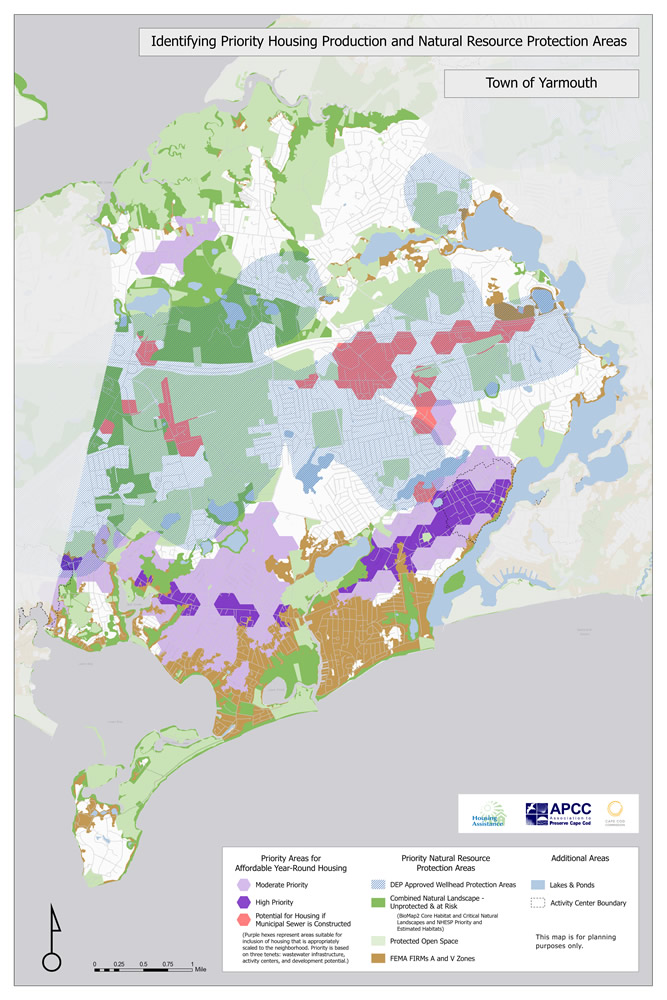
Yarmouth Zone II focus
Maps By Town
The 15 town maps provide a useful compilation of the agreed upon criteria and the best existing data to assist in planning discussions about zoning changes, land acquisitions and potential uses, infrastructure investment and other land use policy issues. By agreeing on the facts, sources of data, and criteria for priorities ahead of time, the project partners hope to make land use policy discussions more productive and efficient. If you have questions about the maps, contact us.
A note about the maps: The individual PDF maps show priority locations for moderate-density affordable housing and priority locations for natural resource protection for each town. However, these static town maps do not depict wetlands, 100-ft. wetland buffers, vernal pools, and 350-ft. vernal pool buffers in order to facilitate easier viewing of the maps at this scale. The interactive web map provides these additional priority natural resources, along with other clickable map features.
BARNSTABLE
CHATHAM
EASTHAM
PROVINCETOWN
TRURO
BOURNE
FALMOUTH
HARWICH
ORLEANS
WELLFLEET
BREWSTER
DENNIS
MASHPEE
SANDWICH
YARMOUTH
HOW MAPS WERE CREATED AND HOW TO USE THEM
APCC and HAC compiled and analyzed existing GIS data layers. To identify high priority areas for housing, a set of criteria was created and applied to each of the 15 towns across the Cape. Areas identified as high priority for natural resource protection are consistent with the 2018 Cape Cod Regional Policy Plan’s criteria for Natural Areas Placetypes and utilize existing state GIS mapping of natural resource areas. The maps are intended as a discussion and planning tool and have no formal regulatory weight.
- Priority natural resources areas, which include critical landscape and habitat areas, Zone II Wellhead Protection Areas for drinking water, wetlands and 100-ft. wetland buffers, vernal pools and 350-ft. vernal pool buffers, permanently protected open space, and FEMA flood zones, are identified for conservation and additional protections.
- Purple areas identify high priority and medium priority areas for moderate-density housing that is affordable and attainable to our year- round population.
- White areas did not rate as high priority for housing or natural resource protection based on the project’s criteria for either purpose. The project recognizes that there may be local strategies for natural resource protection and housing in these areas.
- The maps do not provide parcel-specific analysis, but rather focus on larger areas that would be relevant to zoning, regulations, infrastructure and other planning and policy discussions. The maps are not intended to replace the need for appropriate evaluation at the parcel level.

What is the intended use of the maps?
The 15 town maps provide a useful compilation of the agreed upon criteria and the best existing data to assist planning discussions about appropriate land acquisitions and uses, zoning changes, infrastructure investment and other public and private sector land use policies. By agreeing on the facts, sources of data and criteria for priorities ahead of time, the project partners hope to make land use policy discussions more productive and efficient.
APCC and HAC developed a list of recommendations based on the maps that will assist towns, nonprofit land trusts, housing organizations and others in focusing efforts to protect natural resources and to promote housing production. See full list of policy recommendations.
How should the maps NOT be used?
The maps are intended as a discussion and planning tool, and not to be used as a regulatory document.
The maps do not provide a development analysis at the parcel level. Each parcel has its own peculiarities and due diligence is required. For proposed development within the purple priority housing areas, there may be regulatory hurdles, such as permitting under wetlands protection regulations due to proximity to wetland resources or other site conditions. Likewise, some parcels captured in the priority natural resource layers may already be partially or fully developed.
The maps do not attempt to identify every potential initiative or opportunity for natural resource protection or housing development. It is likely that some lands not identified for either priority use will come under local consideration. The objective of this mapping project is to focus proactive attention on the identified priority areas.
For example, the state-generated natural resource GIS layers do not take into account local open space protection criteria. A local land trust or town open space committee may consider additional criteria when evaluating or targeting properties for acquisition and protection in areas not identified on this map as either priority for housing or natural resource protection, such as connectivity to existing open space or passive recreational opportunities, or targeted local interests (e.g.) use for community garden/agricultural use. Likewise, a parcel of land may become available for housing development that does not fall within the housing or natural resource protection priority areas. In these cases, APCC and HAC agree that the proposed development proceed with public input and according to town review processes that ensure it will meet local and other regulatory requirements.
MAP SOURCE DATA AND CRITERIA
What do the map layers represent?

Dark purple hexagons are 30-acre areas that have been identified as high priority for affordable moderate-density housing production, and the lighter purple represents moderate priority areas for moderate-density housing, which simply means something denser than a single-family home on a lot. Moderate-density housing could appear as a couple of townhouses, a cottage court, top of shop apartments, an accessory dwelling unit, commercial conversion, or an apartment building.
The size of the hexes was selected to avoid focusing on specific parcels, but rather to focus on larger areas that would be relevant to zoning, regulations, infrastructure investment and other policy discussions. Hex areas are rated as priority for moderate-density housing production based on existing wastewater infrastructure and planned wastewater infrastructure, as well as a list of other criteria, such as designation as a village center or activity center, and proximity to public transportation and services.
The Priority Natural Resource Protection Areas represent areas where critical habitat, wetlands, drinking water supplies, open spaces and other sensitive resources are located, many unprotected and at risk. The Priority Natural Resource Protection Areas are consistent with the 2018 Cape Cod Regional Policy Plan’s Natural Areas Placetype designation.
White areas did not rate as high priority for either housing or natural resource protection. For the purposes of this project—to identify high priority areas for either housing or natural resource protection—the project partners make no recommendations for these areas.
What is the source of the data layers?
Natural Resource Protection Areas:
- DEP Approved Zone II Wellhead Protection Areas (MassGIS, 2019)
- BioMap2 Core Habitat (MassGIS, 2011)
- BioMap2 Critical Natural Landscapes (MassGIS, 2011)
- NHESP Priority Habitat (MassGIS, 2021)
- NHESP Estimated Habitat (MassGIS, 2021)
- Protected Open Space (MassGIS, 2021)
- Wetlands and 100-Foot Buffer to Wetlands (MassGIS/Cape Cod Commission, 2019)
- Vernal Pools and 350-Foot Buffer to Vernal Pools (MassGIS/Cape Cod Commission, 2020)
- FEMA FIRMS A and V Zones (MassGIS, 2019)
Housing Data Sources:
- Town wastewater treatment plans. Highest scoring was given to currently sewered areas, second highest scoring to areas with phase 1 and phase 2 sewering plans.
- Business Activities Sites, from the Cape Cod Commission, via ESRI Business Analyst Data Cape Cod Chamber of Commerce
- Community Activity Sites, from the Cape Cod Commission, via Massachusetts Department of Elementary and Secondary Education (MassGIS), National Center for Education Statistics (MassGIS), Massachusetts Board of Library Commissioners (MassGIS), Department of Public Health – Office of Emergency Medical Services (MassGIS), Cape Cod Chamber of Commerce, and Department of Homeland Security’s Homeland Security Infrastructure Program (HSIP)
- Additional scoring was given for areas that had existing multifamily housing, underutilized commercial properties, or proximity to activity centers.
- Activity Centers from the Cape Cod Commission Regional Policy Plan (RPP)—shown by dotted lines on maps—include a density of housing, commercial or other activity, sidewalks and other indicators of a walkable neighborhood.
How was the housing layer determined?
Each parcel was scored for “housing priority” using a variety of criteria with the goal of identifying areas where affordable moderate density housing is most appropriate based on existing development patterns, amenities, community resources and infrastructure.
1. Wastewater Infrastructure
- Has Sewer – 7 points
- Planned Sewer Phase 1 and 2 – 5 points
- No Sewer and no plans – 0 points
2. Economic and Community Activity (existing density, businesses, recreation, bike paths, transportation route)
- Proximity to Cape Cod Commission defined Activity Centers
Within AC – 1.5 points
Within 1/4 Mile of AC – 1 point
Within 1/2 Mile of AC – .75 point
Within 3/4 Mile of AC – .5 point
Within 1 Mile of AC – .25 point - Existing Business Activity (categories as defined by the Cape Cod Commission)
Sparse – 1 point
Patchy – 2 points
Dense – 3 points
Core – 4 points - Existing Community Activity (categories as defined by the Cape Cod Commission)
Sparse – 1 point
Patchy – 2 points
Dense – 3 points
Core – 4 points - Multifamily housing – 1 point – MF is defined as state class code (112, 111, 109, 105, 104)
- Transportation – 1 point for parcels within ¼ mile of CCRTA route
- Sidewalk Adjacency – 1 point for parcels adjacent to sidewalks (5m)
- Bicycle Access – 1 point for parcels within ¼ mile of bike trails (i.e. bike only trails, not shared roads designated as bike routes)
3. Underdeveloped areas (these would be areas that have town-owned vacant lots, underdeveloped commercial space)
- Underdeveloped Commercial – 4 points for Underdeveloped Commercial Parcels with Commercial structures circa 1950-1980 + low assessed value ($140/sq. ft.)
- Vacant Town-Owned Land – 2 points for Vacant Town-Owned Parcels (USE_CODE IN (930s, 970, 973, 980s except 982))
- Vacant Developable Land – 2 points for Vacant Developable Parcels (USE_CODE IN (130, 131, 390, 391, 440, 441))
Next, the parcel scoring was used to generate a thematic hexagon map, which normalized the scoring for the parcels across entire neighborhoods. The map averages the scoring of the underlying parcels within 30-acre hexagons and highlights differences in housing priorities from neighborhood to neighborhood, not parcel to parcel. The hexagons were shaded into three categories using a “Natural Breaks Classification method (Jenks)” method:
- Lowest Scoring Hex Group (shaded white) – Not a priority for housing
- Middle Scoring Hex Group (shaded light purple) – Moderate priority for affordable moderate-density housing
- Highest Scoring Hex Group (shaded dark purple) – Highest priority for moderate-density housing
In addition, all hexes that fall within a Zone II Wellhead Projection Area are shaded white (not housing priority), unless that area has municipal sewer or has a Phase 1 or Phase 2 plan for municipal sewer.
The hex neighborhood approach allows the towns to think more broadly about the areas of their communities that should be targeted for housing. Regardless of scoring, prior to building new housing on any given parcel, a site suitability analysis will need to be undertaken by any developer, as we did not analyze the suitability of any individual site as part of this project.